In the below learn how using Google Chrome's built-in DevTools I was able to debug javascript in Chrome that improved the page load time for our client.
I was recently in a situation where, in trying to optimize a site for performance reasons, I needed to track down what was generating some above-the-fold content. Specifically, this was a client's site that we had inherited as part of a Drupal support contract. On mobile-sized screens, the homepage was displaying a banner ad for the company's mobile app, which provided a download link for the app.
I knew that the banner was likely being generated by some sort of JavaScript snippet somewhere on the site. A Google PageSpeed Insights report had complained of the need to "prioritize visible content", and indicated that "your page requires additional network round trips to render the above-the-fold content. For best performance, reduce the amount of HTML needed to render above-the-fold content." So it was clear that there was some bit of JavaScript that was rendering additional markup after the full HTML response was rendered.
Unfortunately, even after numerous searches of the site's codebase, nothing came up related to the markup being rendered for this mobile banner ad. The mystery JavaScript in question was nowhere to be found. And since I only had access to the resulting HTML markup, rather than the JavaScript that produced it, I didn't have much to go on.
However, this failure to locate the HTML or JavaScript with a simple search of the codebase led to an interesting opportunity to search for it via other debugging methods. Specifically, I was able to approach the problem from a live debugging perspective instead, using Google Chrome's built-in DevTools.
Any developer who uses Chrome to test their local development work will be well acquainted with Chrome's built-in DevTools suite. Most of the time, we are using Chrome DevTools to simply inspect an HTML element more closely or to check the browser console for JavaScript runtime errors.
However, to help with my problem with tracking down some JavaScript code at runtime, I came across the ability to set breakpoints using DevTools. As explained in the DevTools documentation, you can "use breakpoints to pause your JavaScript code and investigate the values of variables and the call stack at that particular moment in time." This was welcome news to a developer like me who is used to using breakpoints in my code editor when debugging things like complex PHP codebases.
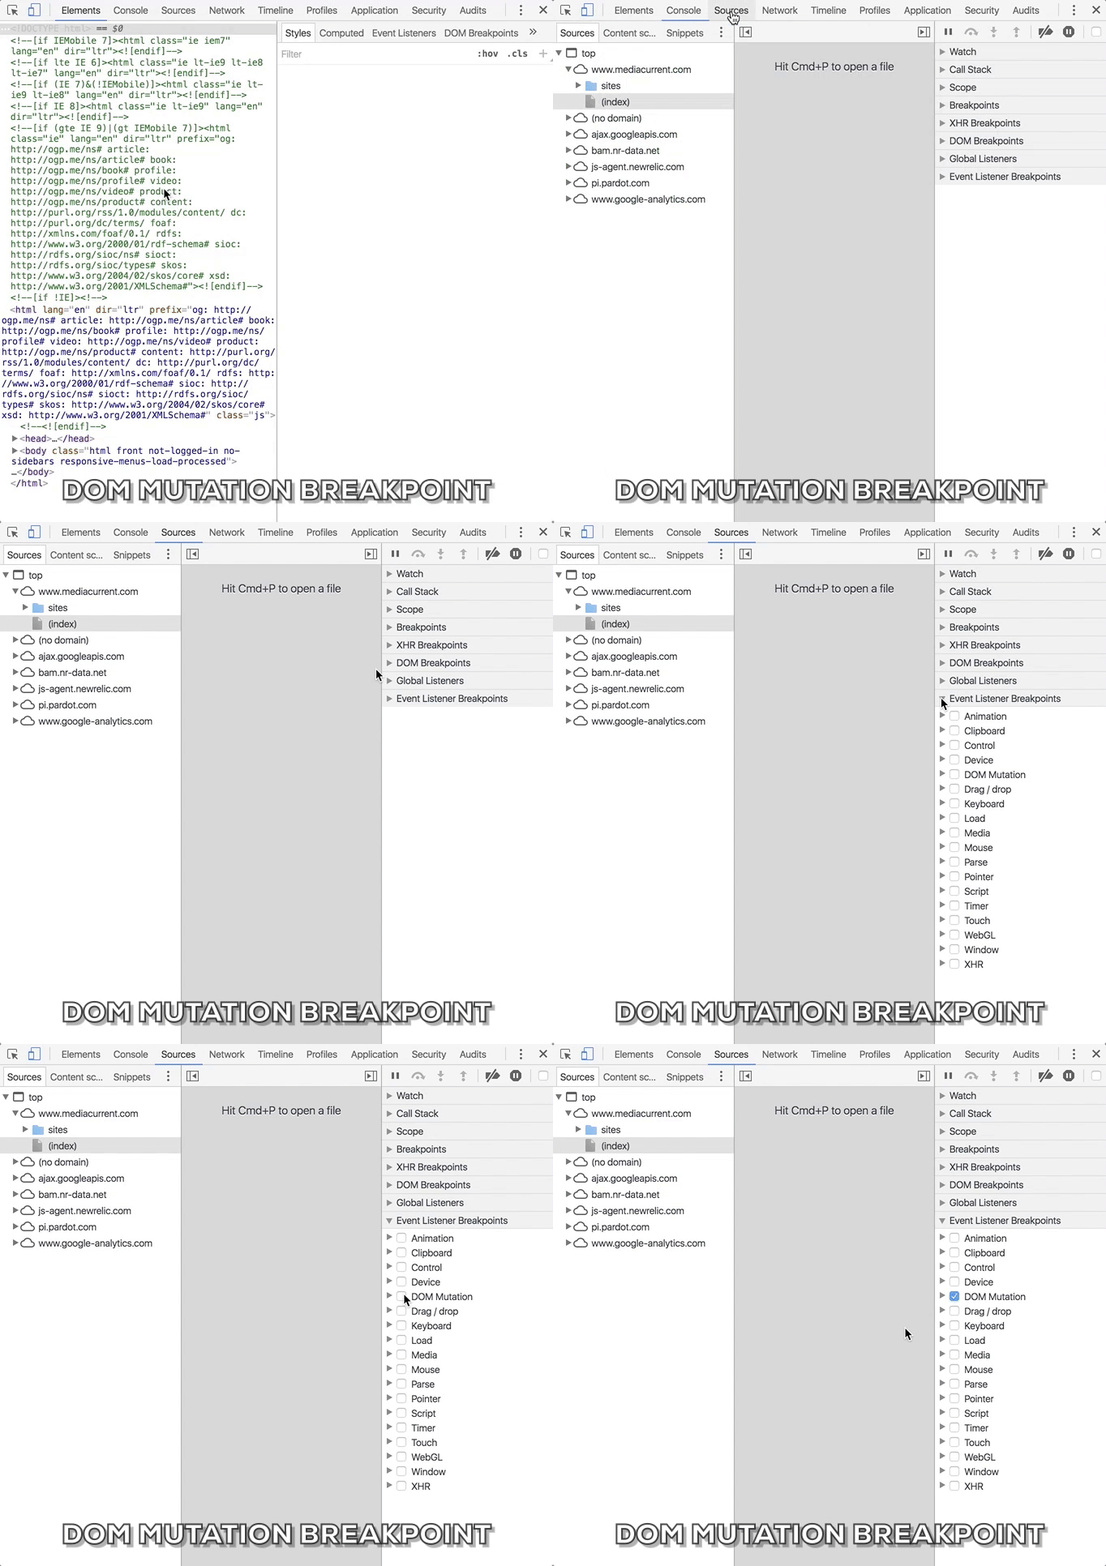
To test out JavaScript breakpoints yourself, it is probably best to check out their official documentation. But, basically, there are two ways to set breakpoints from within the DevTools UI: [1] You can manually set a breakpoint on a specific line of code (or HTML markup), or [2] you can set a breakpoint to be triggered by certain conditions, such as a change to the DOM.
In my case, I was trying to locate and debug JavaScript code that was modifying the page's HTML/DOM, so I needed to use the latter method in order to set an "Even Listener Breakpoint" that would be triggered whenever a "DOM Mutation" was detected.

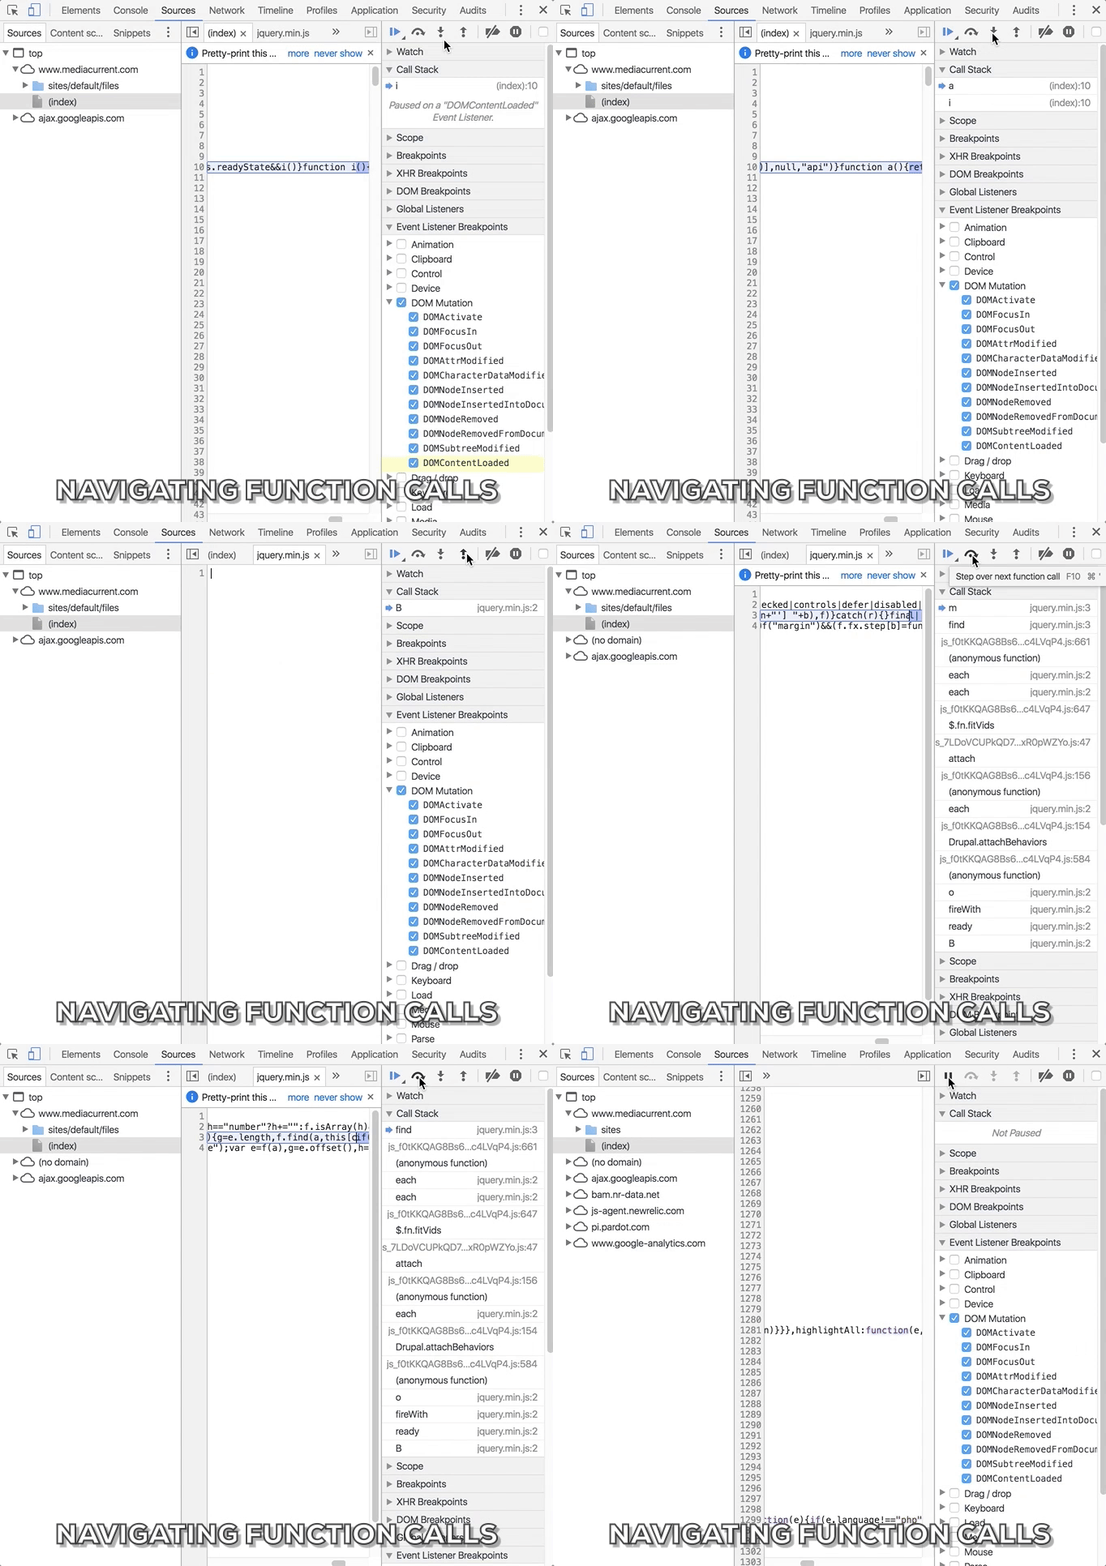
With this breakpoint in place, Chrome will pause the page rendering process after any change to the DOM is detected. You can then take control of the process with some basic debug steps, like stepping into, out of, or over each function call, or resuming script execution as normal.

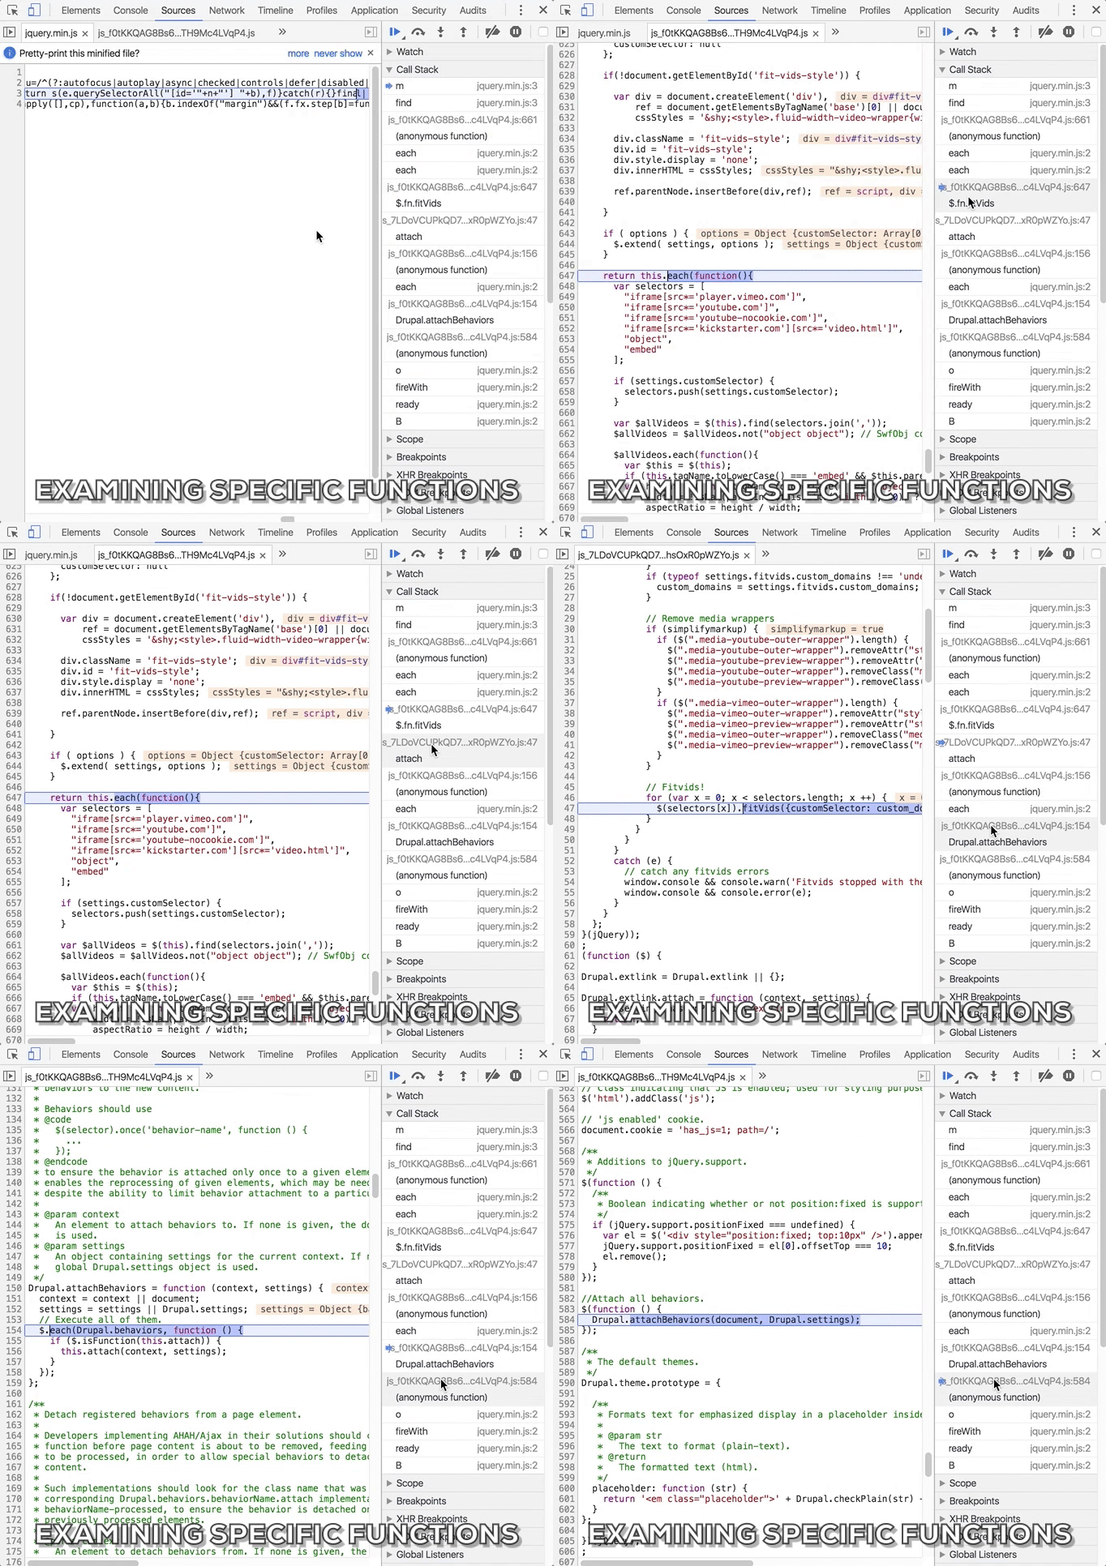
Once you think you've located the function calls you're looking for, you can examine each individual function call by clicking on its name in the call stack, which will bring up the exact code in question within your DevTools console.

By using these methods together, I was able to track down the troublesome JavaScript in no time and fix the issue at hand. So, the next time you run into a pesky debug JavaScript issue on your own project, give these Chrome DevTools a try yourself!